A. Inflation expectations
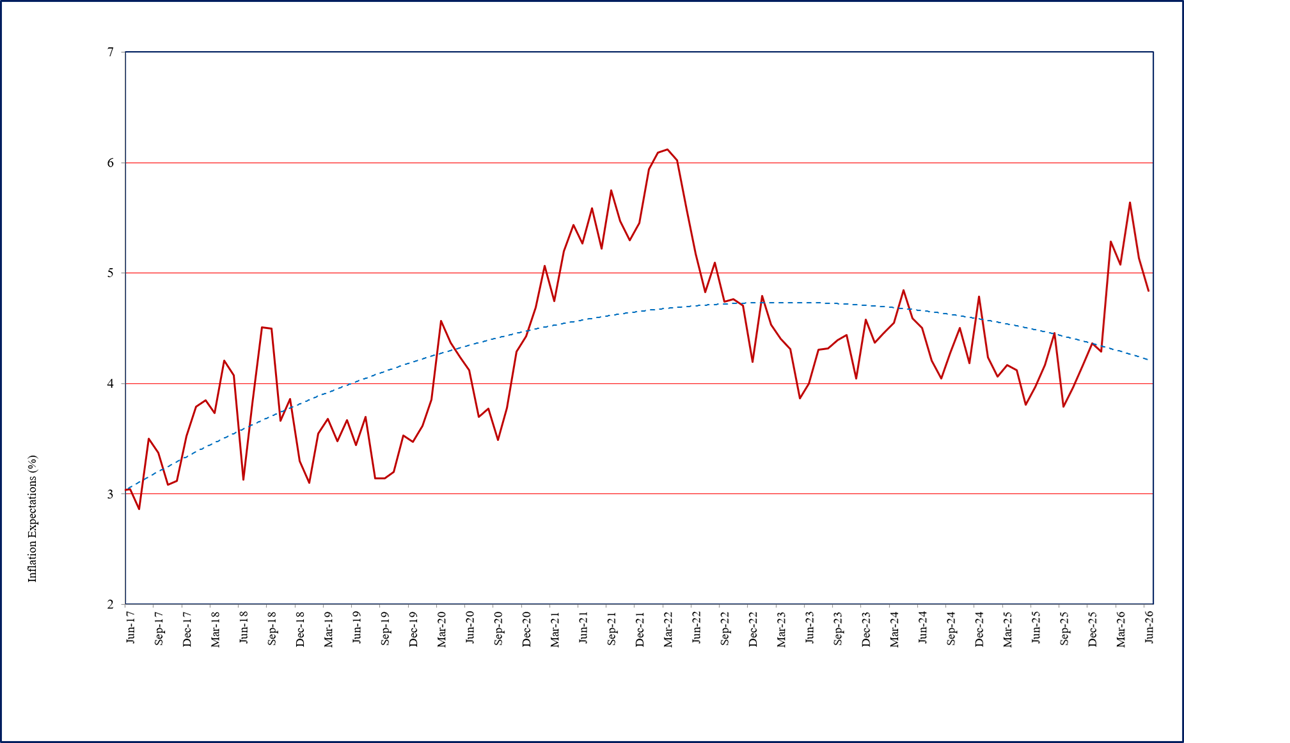
- One year ahead business inflation expectation in June 2026, as estimated from the mean of individual probability distribution of unit cost increase, has further declined by 29 bps to 4.84%, from 5.13% reported in May 2026. Firms’ inflation expectations dropped below 5% after a span of four months. The trajectory of one year ahead business inflation expectations of firms is presented in Chart 1.
- The uncertainty of business inflation expectations in June 2026, as captured by the square root of the average variance of the individual probability distribution of unit cost increase, remained elevated at over 2% for the past six consecutive months.
Chart 1: One year ahead business inflation expectations (%)
- Respondents were also asked to project one year ahead CPI headline inflation through an additional question using a probability distribution. This question is repeated every alternate month, coinciding with the RBI’s bi-monthly monetary policy announcement.
1The Business Inflation Expectations Survey (BIES) provides ways to examine the amount of slack in the economy by polling a panel of business leaders about their inflation expectations in the short and medium term. This monthly survey asks questions about year-ahead cost expectations and the factors influencing price changes, such as profit, sales levels, etc. The survey is unique in that it goes straight to businesses - the price setters - rather than to consumers or households, to understand their expectations of the price level changes. One major advantage of BIES is that one can get a probabilistic assessment of inflation expectations and thus get a measure of uncertainty. It also provides an indirect assessment of overall demand condition of the economy. Results of this Survey are, therefore, useful in understanding the inflation expectations of businesses and complement other macro data required for policy making. With this objective, the BIES is conducted monthly at the Misra Centre for Financial Markets and Economy, IIMA. A copy of the questionnaire is annexed.
Companies are selected primarily from the manufacturing sector. Starting in May 2017, the “BIES – June 2026” is the 110 th round of the Survey. These results are based on the responses of around 1000 companies.
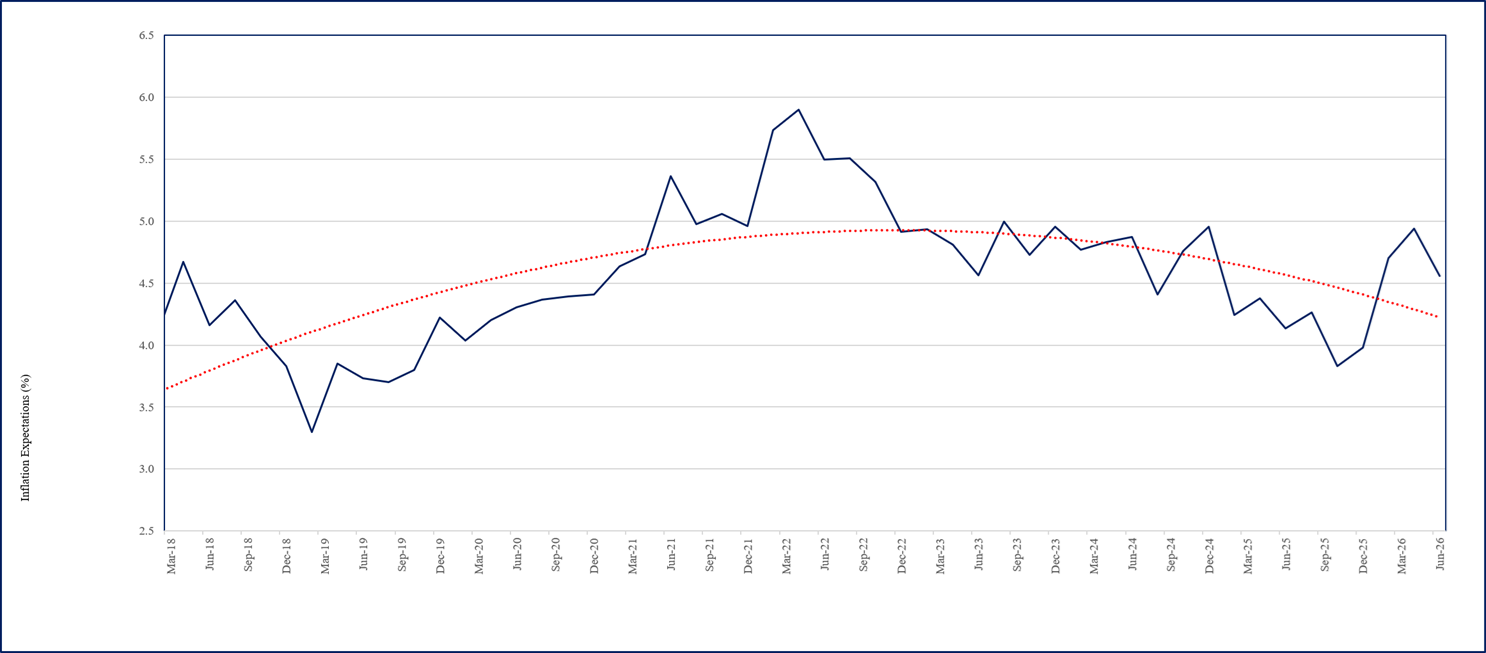
- The businesses in June 2026 expect one year ahead CPI headline inflation to be at 4.56%, down by 38 basis points from 4.94% reported in April 2026 (Chart 2). However, firms’ uncertainty of CPI inflation expectations has remained elevated at over 1.0% during February 2026 to June 2026 period.
Chart 2: Expected CPI headline inflation (%) - one year ahead
B. Costs
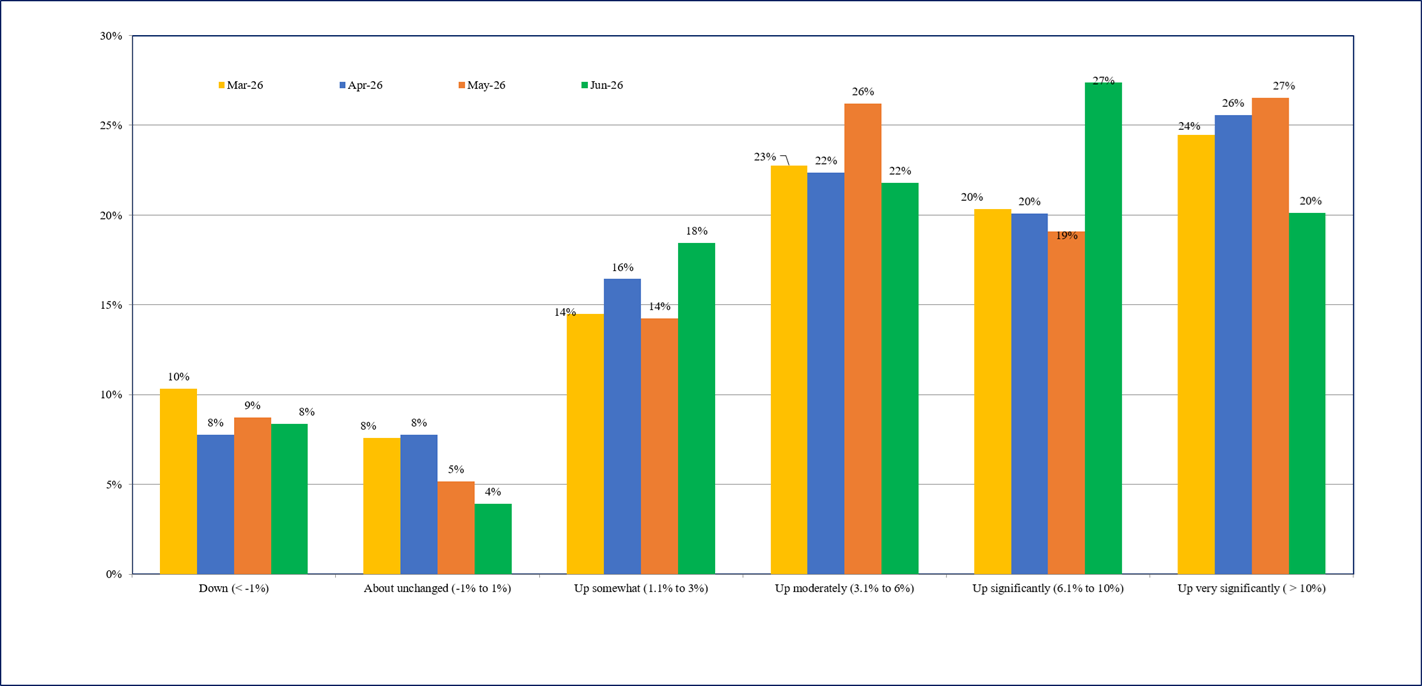
- The cost perceptions data in June 2026 indicates a mixed signal. The percentage of firms perceiving significant cost increase (in the range of 6% to 10%) has increased sharply from 19% to 27%. At the same time, the percentage of firms perceiving very significant cost increase (more than 10%) has declined from 27% to 20%.
- Overall, the percentage of firms perceiving costs ‘up significantly’ and above (over 6%) has remained around 46% for three consecutive months (Chart 3).
Chart 3: How do current costs per unit compare with this time last year? – % responses
C. Sales Levels
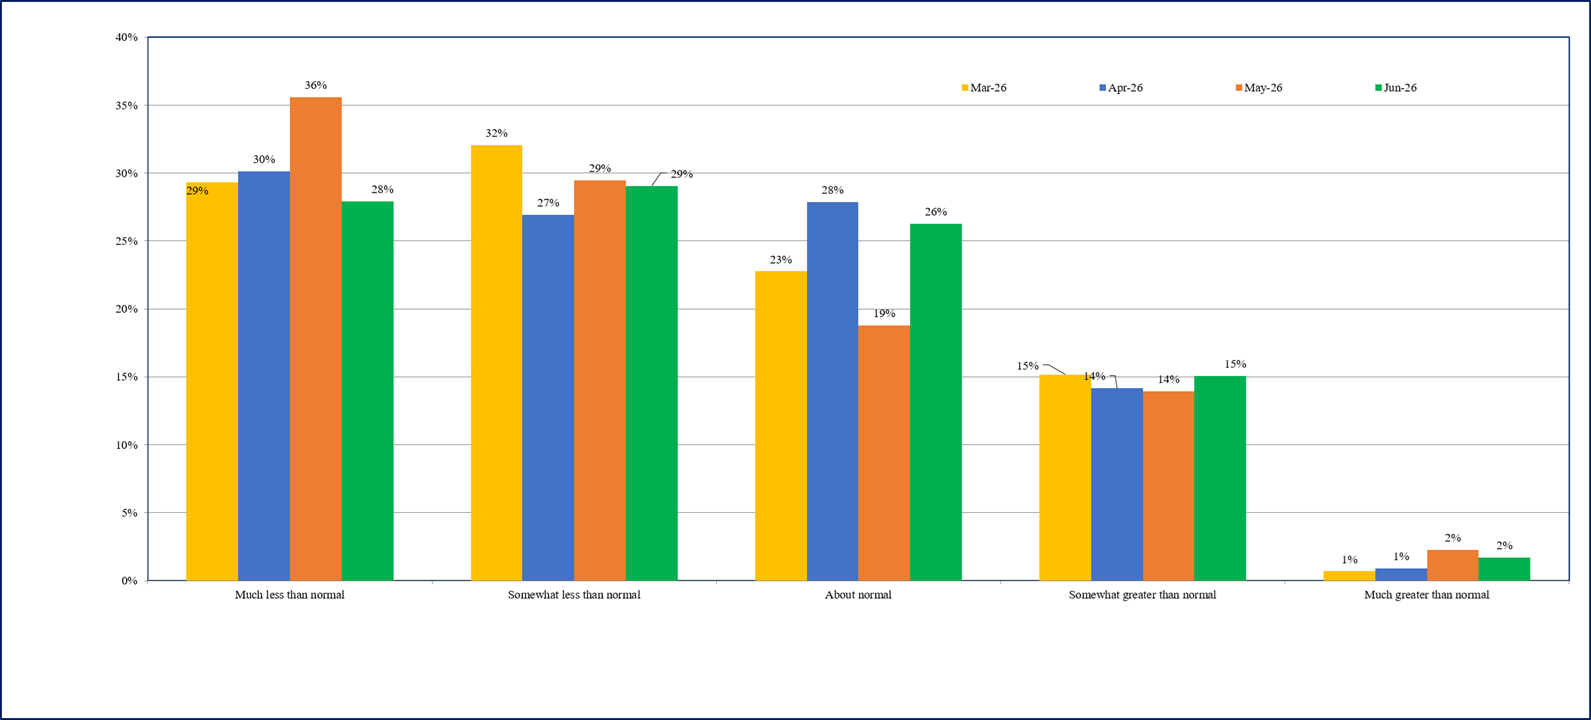
- Firms’ sales expectations have improved in June 2026.
- Around 43% of firms in June 2026 are reporting ‘about normal’ 2 and greater sales, sharply up from 35% reported in May 2026 (Chart 4).
Chart 4: Sales Levels - % response
D. Profit Margins
- The percentage of firms reporting ‘somewhat less than normal’ or below profit margin expectations has declined to 73% in May 2026 from 78% reported in April 2026 (Chart 5).
- Overall, the profit margin expectations show signs of improved performance.
Chart 5: Profit Margins - % response
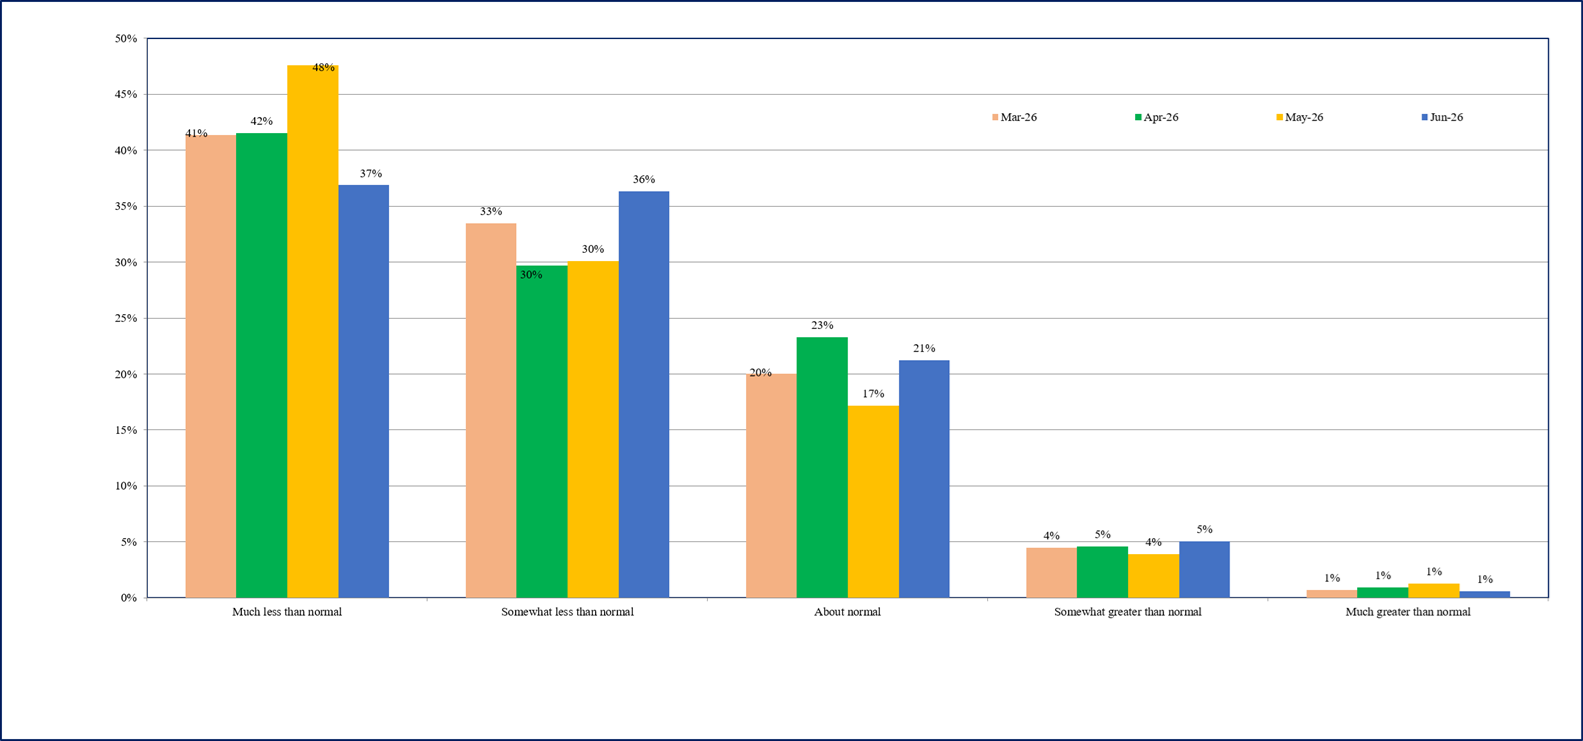
2"Normal" means as compared to the average level obtained in the preceding 3 years.
Business Inflation Expectation Survey (BIES) – Questionnaire
|
A. Current Business Conditions
Q1. How do your current PROFIT MARGINS@ compare with "normal" * times?
o Much less than normal
o Somewhat less than normal
o About normal
o Somewhat greater than normal
o Much greater than normal
Q2. How do your current sales levels compare with SALES LEVELS@ during what you consider to be "normal"* times?
o Much less than normal
o Somewhat less than normal
o About normal
o somewhat greater than normal
o Much greater than normal
@ of the main or most important product in terms of sales.
*"normal" means the average level obtained during the corresponding time point of preceding 3 years, excluding the Covid-19 period.
|
B. Current Costs Per Unit^
Q3. Looking back, how do your current COSTS PER UNIT compare with this time last year?
o Down (< -1%)
o About unchanged (-1% to 1%)
o Up somewhat (1.1% to 3%)
o Up moderately (3.1% to 6%)
o Up significantly (6.1% to 10%)
o Up very significantly (> 10%)
' of the main or most important product in terms of sales. |
|
C. Forward Looking Costs Per Unit$
Q4. Projecting ahead, to the best of your ability, please assign a percent likelihood (probability) to the following changes to costs per unit$ over the next 12 months.
o Unit costs down (less than -1%)
o Unit costs about unchanged (-1% to 1%)
o Unit costs up somewhat (1.1% to 3%)
o Unit costs up moderately (3.1% to 6%)
o Unit costs up significantly (6.1% to 10%)
o Unit costs up very significantly (> 10%)
$ of the main or most important product in terms of sales.
Values should add up to 100%.
|


